Explore the Data

SeaFlow provides high-resolution data on the abundance, optical properties, size, and carbon content of phytoplankton populations, as well as their cellular growth rate and net production.
SeaFlow data are processed using 3 key steps: filtration, classification, and data conversion. The filtration step identifies particles in focus, and the classification step categorizes particles based on optical properties. The data sets are then expanded to include equivalent spherical diameter (ESD) and carbon quotas derived from light scatter measurements. Rates of changes of these properties over time are calculated to estimate cellular growth rates and net production.
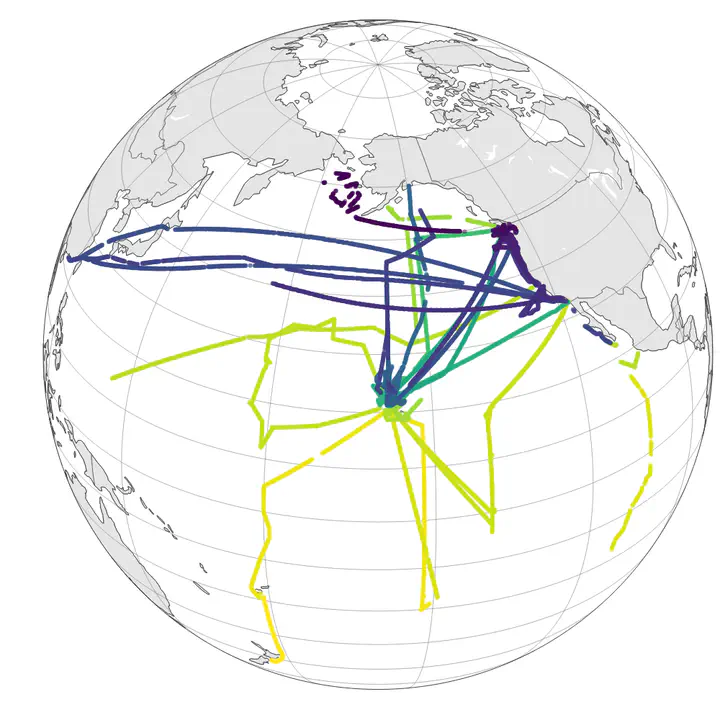
A example dataset that combines observations from 64 cruises is available at Zenodo.

SeaFlow collects the following state estimate data:
- Abundance: SeaFlow measures the concentration of different phytoplankton populations in the water. This data helps track changes in the abundance and distribution of these organisms over space and time, providing insights into the factors influencing their growth and survival.
- Optical Properties: SeaFlow measures the light scattering and fluorescence emitted by phytoplankton cells, providing information about their size and pigments they contain. These pigments, such as chlorophyll a and phycoerythrin, are used for photosynthesis and can be used to distinguish different phytoplankton groups.
- Equivalent Spherical Diameter (ESD) : A simplified Mie theory model is used to convert the light scatter data into per cell diameter, assuming a spherical shape.
- Carbon Quotas: This estimate of the carbon content of individual cells is derived from the ESD, using empirical cell volume to carbon conversion factors.
- Carbon biomass: This is the total carbon content of each phytoplankton population, calculated by multiplying the carbon quota by the cell abundance.
And the following rate estimate data:
- Cellular Growth Rate: This rate is calculated from the daytime rate of change in carbon quotas over time using time-series analysis techniques, such as time decomposition analysis.
- Net Production: Net production is calculated by multiplying the cellular growth rate by the carbon biomass, providing an estimate of overall carbon production by the phytoplankton community.
Learn More: For more information about the SeaFlow’s data, please refer to these two articles:
- State estimation: https://doi.org/10.1038/s41597-019-0292-2
- Rate estimation: https://doi.org/10.1002/lno.12683