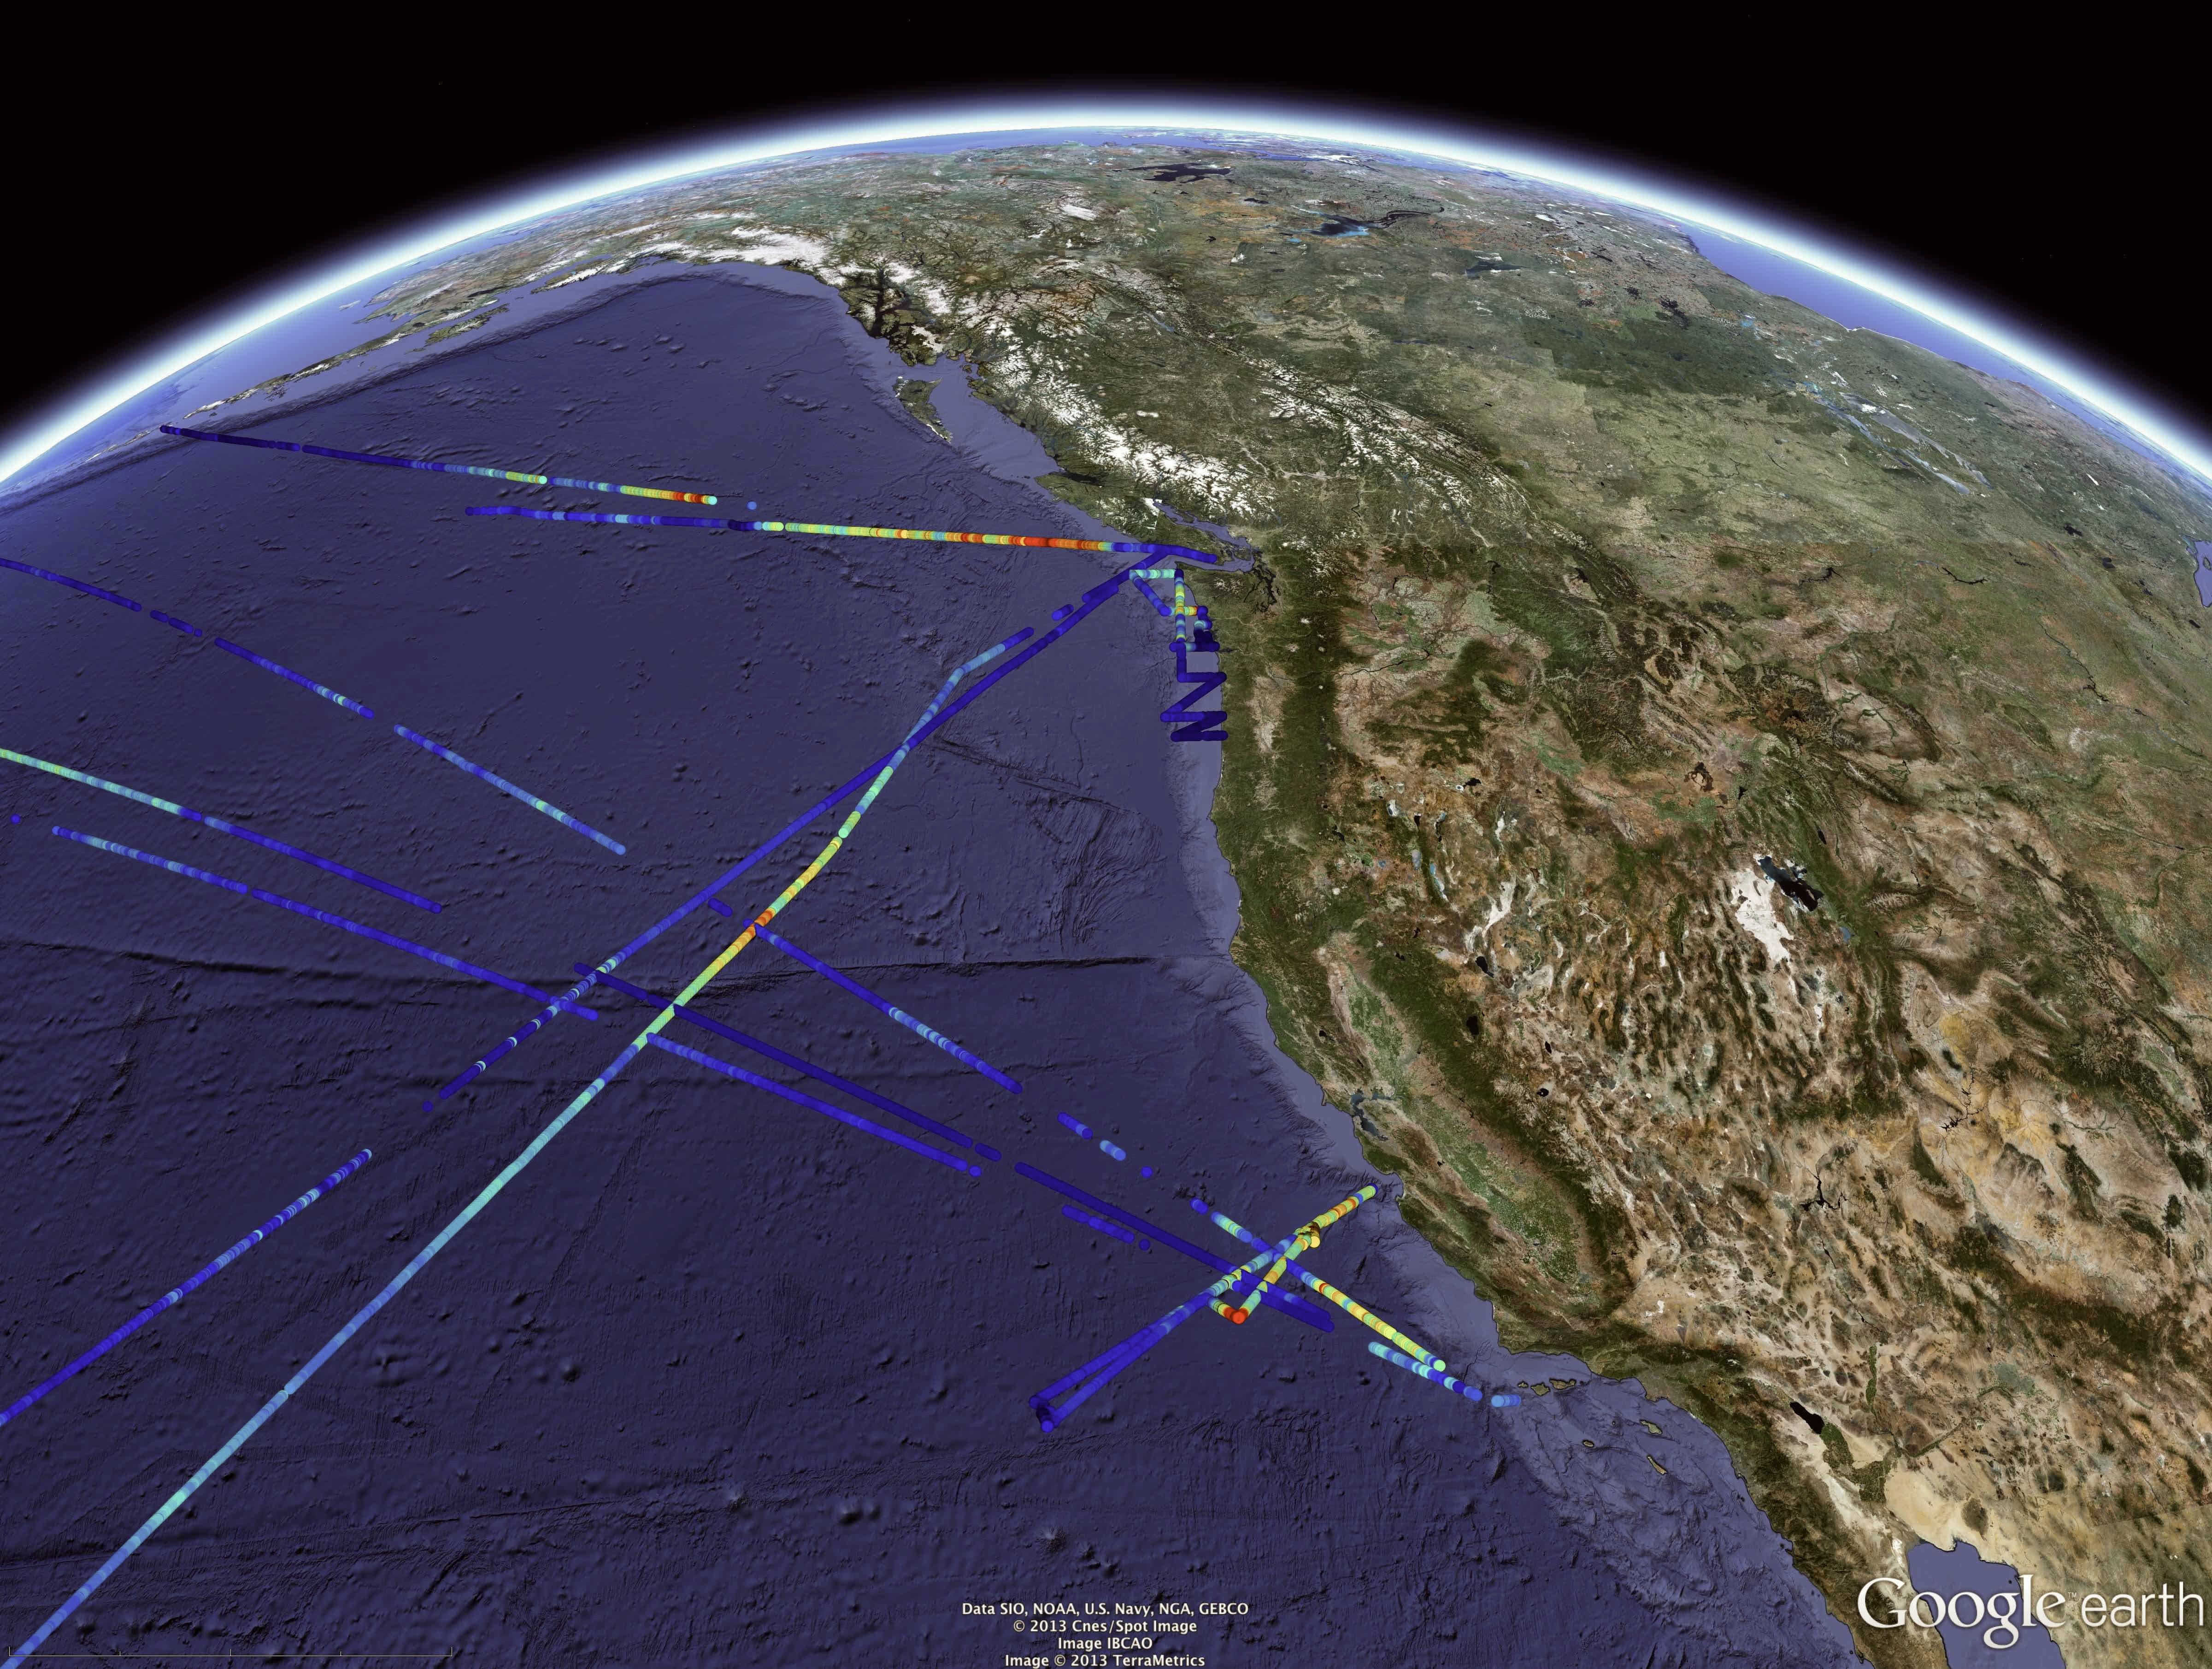
We generate high-resolution datasets of marine phytoplankton communities using SeaFlow continuous sampling. Our data products provide both instantaneous measurements and process rates that reveal how marine microbes drive ocean biogeochemistry.

State Estimates
Figure 1. SeaFlow state estimates during a Pacific Ocean transect (December 2019). Upper panels show abundance (left) and carbon quotas (right) for four phytoplankton populations: nanoeukaryotes (yellow), picoeukaryotes (green), Synechococcus (blue), and Prochlorococcus (purple). Lower panel displays total phytoplankton biomass with color-coded contributions from each population.

We also develop size-structured matrix population models to estimate fundamental biological processes that drive phytoplankton population dynamics from SeaFlow time series data.

Rate Estimates
Figure 2. SeaFlow rate estimates from size-structured matrix population models during a Pacific Ocean transect. Left panels show daily division rates, middle panels display carbon fixation rates, and right panels present carbon loss rates for each population.

Data Access: Most of our data products are available through public repositories and include quality control flags and uncertainty estimates. Abundance, size, carbon content and biomass data are available at Zenodo. Rate of cell division are available at Zenodo.

We have created a dashboard to provide an interactive platform to show real-time and past SeaFlow data. See your live dashboard at seaflowcruise.org